
Sample City Water Network
Operate capacity, hydraulic and equitable-distribution scenarios
This is a live dashboard. Click any source, plant, storage, pump, tank or ward valve to change the network and see the consequence.
Prefer a visual experience? Play the 3D city →0 L/sRaw-water pump
0 L/sTreated output
7.5 MLPost-WTP storage
0 / 0 L/sEnd flow / ward demand
0% spreadAllocation equity
0Active warnings
Operational water network Click any asset or valve to inspect and operate it
Raw-water intake and treatment
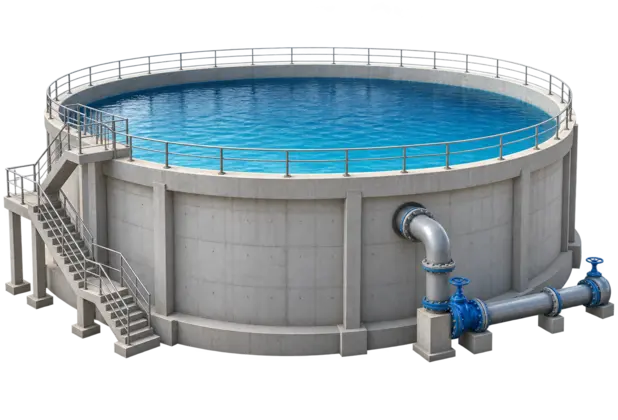
Water Source
228 L/s available
Jackwell
Raw-water pump · AUTO
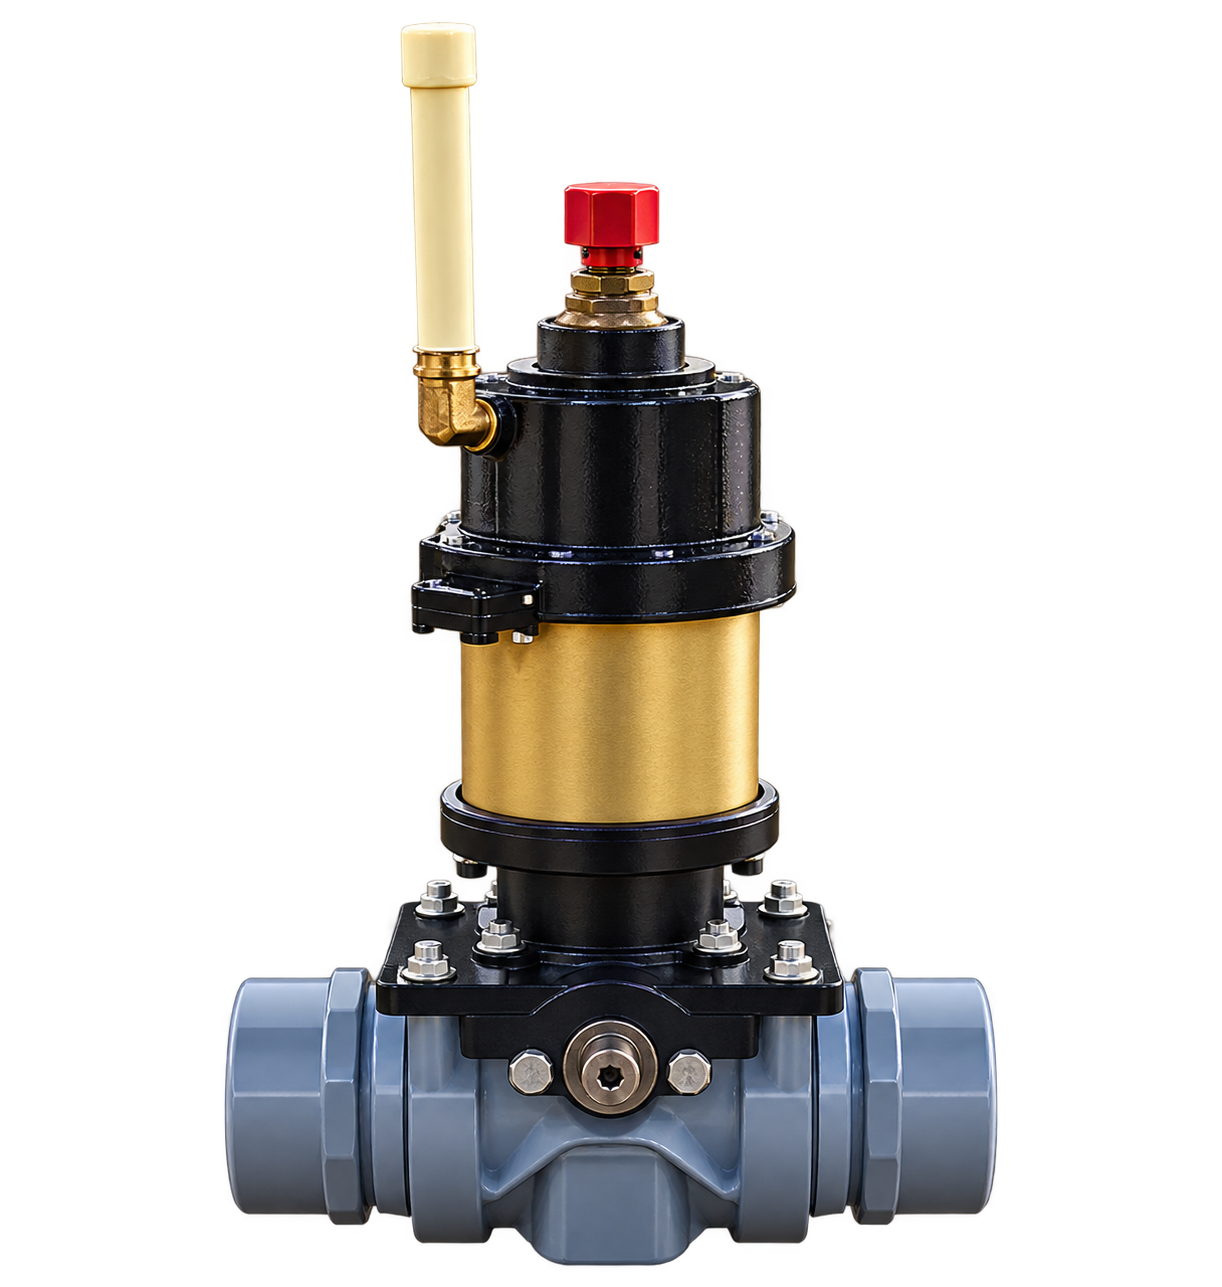
IN VALVE
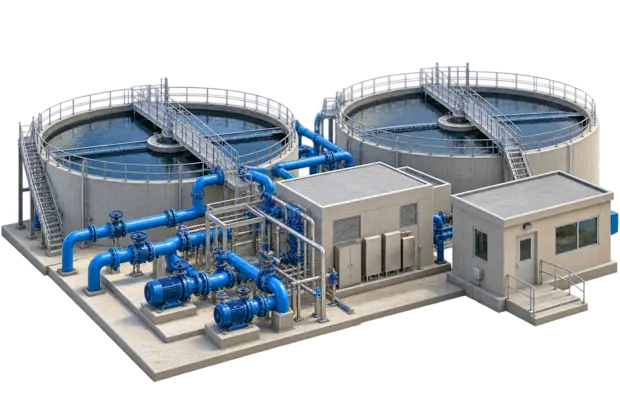
WTP 1
96 L/s flowing
OUT VALVE
IN VALVE
WTP 2
117 L/s flowing
OUT VALVE
WTP 1 TREATED WATER → STORAGE 1
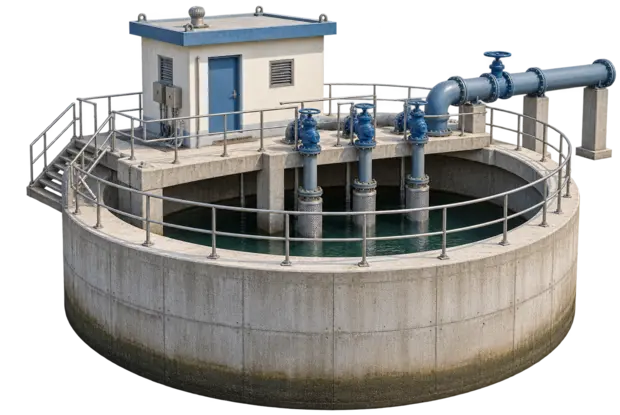
Storage 1
76.0% · receiving 96 L/s
WTP 2 TREATED WATER → STORAGE 2
Storage 2
68.0% · receiving 117 L/s
Synchronous storage outlet valves, pumps and OHT distribution routes
Storage 15.2 ML tank
OUTLET VALVE
86% OPEN
Storage Pump 1
AUTO · 0 L/s
OHT 1–3Route A
Storage 25.8 ML tank
OUTLET VALVE
88% OPEN
Storage Pump 2
AUTO · 0 L/s
OHT 4–7Route B
OHT control, population demand, equitable allocation and ward-pipe hydraulics
Route AStorage Pump 1 → OHT 1–30 L/s
Route BStorage Pump 2 → OHT 4–70 L/s
Flowing waterCharged pipe, zero flowGreen: operatingSteady blue: program HOLDFlashing amber: protective interlockFlashing red: fault / safety tripSolid red: manual stop / closedTank level bandsFeasibility model: mass balance + Hazen–Williams friction + population allocation · 5 simulated minutes/second